样条函数与插值
样条
节点之间为n次多项式。
B 样条(B-Splines)
样条基的线性组合。B: Basis,基。
常数 B 样条
不连续。线性 B 样条 (linear)
连续。二次 B 样条 (quadratic)
一阶导连续。三次 B 样条 (cubic)
二阶导连续。
非均匀有理 B 样条(Non-Uniform Rational B-Splines, NURBS)
B 样条的超集。将多项式推广为有理多项式。有理多项式:可化为两个多项式之商的表达式。
计算机图形学里将 Bezier、有理 Bezier、均匀 B 样条和非均匀 B 样条都统一到NURBS中。
样条插值
样条是通过节点的最小曲率曲线的近似。
样条的优点:光滑,点只作用于局部
样条拟合
可以控制曲线的光滑程度,不需要通过数据点。
在数据有内禀弥散时,可以使用。
Python 实现
样条插值一般用 scipy.interpolate.interp1d 就行了。
如果要做样条曲线拟合,可以用 scipy.interpolate.UnivariateSpline。
例子
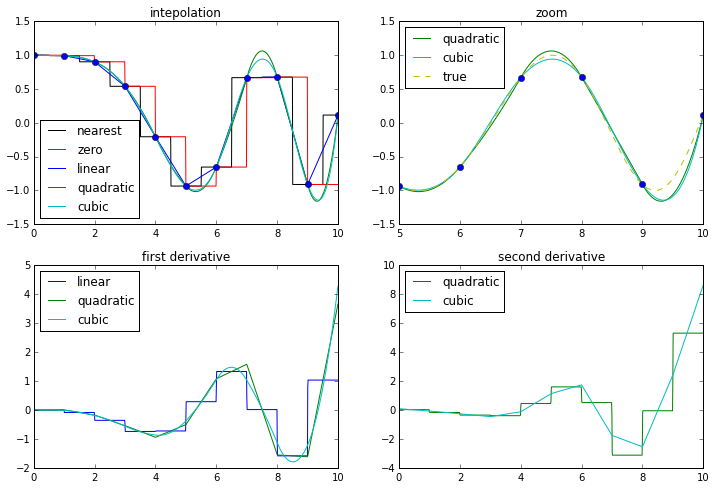
注意下图中的一阶和二阶导数。

代码如下
from pylab import *
from scipy.interpolate import interp1d

color = {'nearest':'k', 'zero':'r', 'linear':'b', 'quadratic':'g', 'cubic':'c'}
f_raw = lambda x:cos(-x**2/9)
X = linspace(0, 10, num=11)
Y = f_raw(X)

figure(figsize=(12,8))
subplot(221)
title('intepolation')
x = np.linspace(0, 10, num=1001, endpoint=True)
for kind in ['nearest', 'zero', 'linear', 'quadratic', 'cubic']:
    f = interp1d(X, Y, kind=kind)
    y = f(x)
    plot(x, y, label=kind, color=color[kind])
legend(loc=3)
plot(X, Y, 'o')


subplot(222)
title('zoom')
x = np.linspace(0, 10, num=1001, endpoint=True)
for kind in ['quadratic', 'cubic']:
    f = interp1d(X, Y, kind=kind)
    y = f(x)
    plot(x, y, label=kind, color=color[kind])
plot(x, f_raw(x), 'y--', label='true')
plot(X, Y, 'o')
legend(loc=2)
xlim(5, 10)


subplot(223)
title('first derivative')
x, dx = np.linspace(0, 10, num=1000, endpoint=True, retstep=True)
for kind in ['linear', 'quadratic', 'cubic']:
    f = interp1d(X, Y, kind=kind)
    y = f(x)
    plot((x[:-1]+x[1:])/2, diff(y)/dx, label=kind, color=color[kind])
legend(loc=2)

subplot(224)
title('second derivative')
x, dx = np.linspace(0, 10, num=1000, endpoint=True, retstep=True)
for kind in ['quadratic', 'cubic']:
    f = interp1d(X, Y, kind=kind)
    y = f(x)
    plot(x[1:-1], diff(y, 2)/dx**2, label=kind, color=color[kind])
legend(loc=2)
- 上一篇: 搬家有感
- 下一篇: 用 Astropy 进行单位换算